📊 📃Infographic
127 Years of Dutch Graphic Design
│
By:
✍️F. N. van der Vlist
│
On:
🕓2010, June 28
│
In:
🏢Willem de Kooning Academy (Rotterdam University of Applied Sciences)
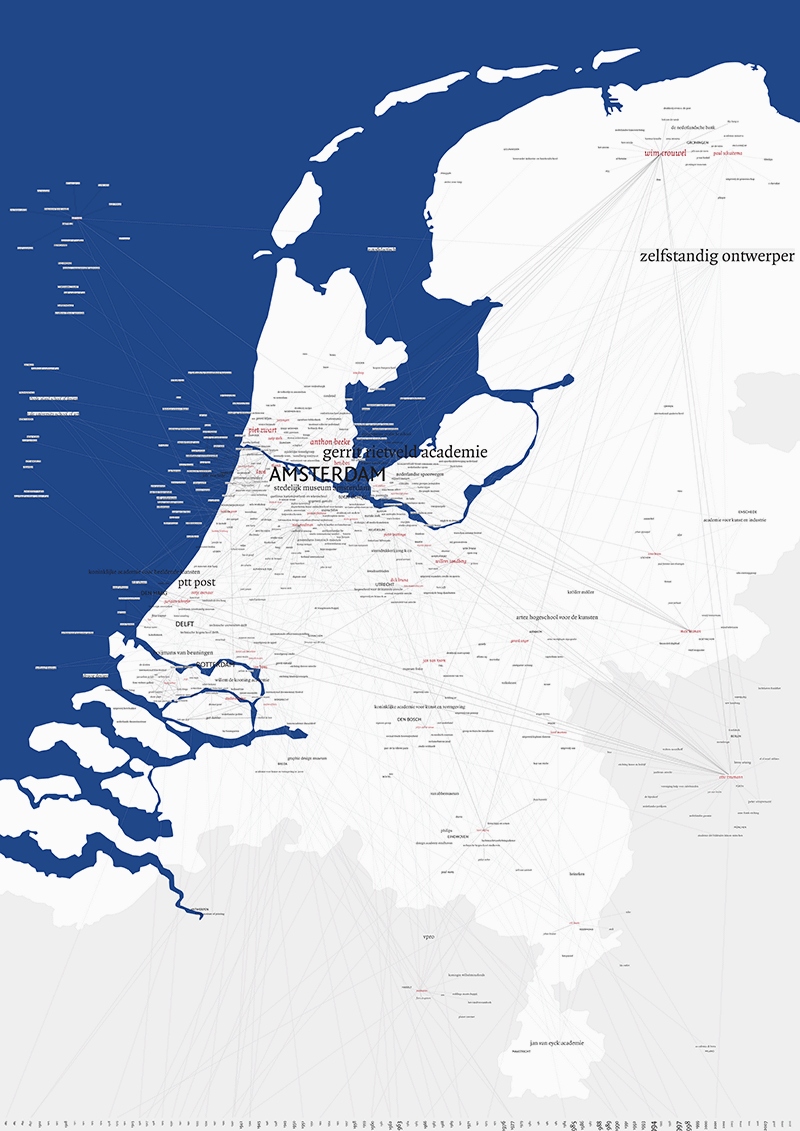
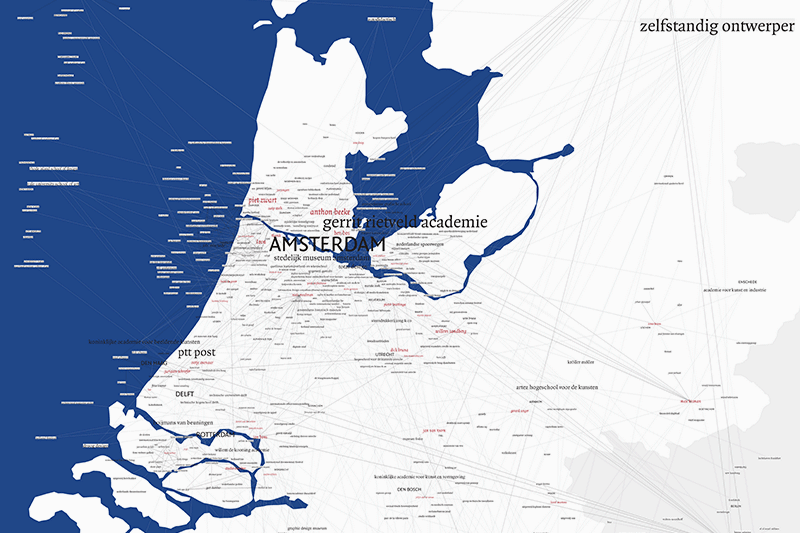
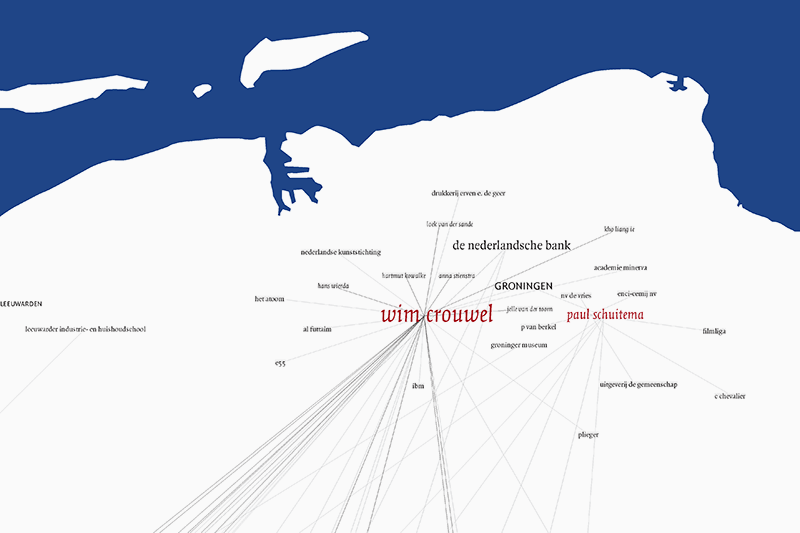
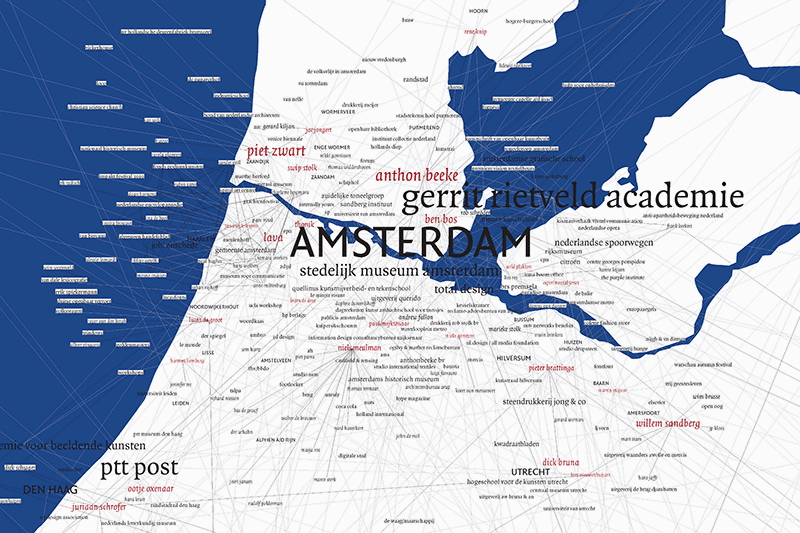
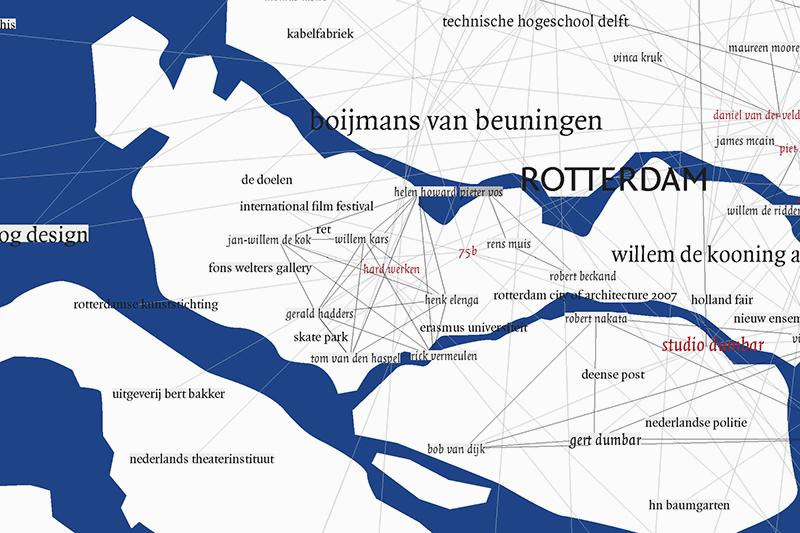
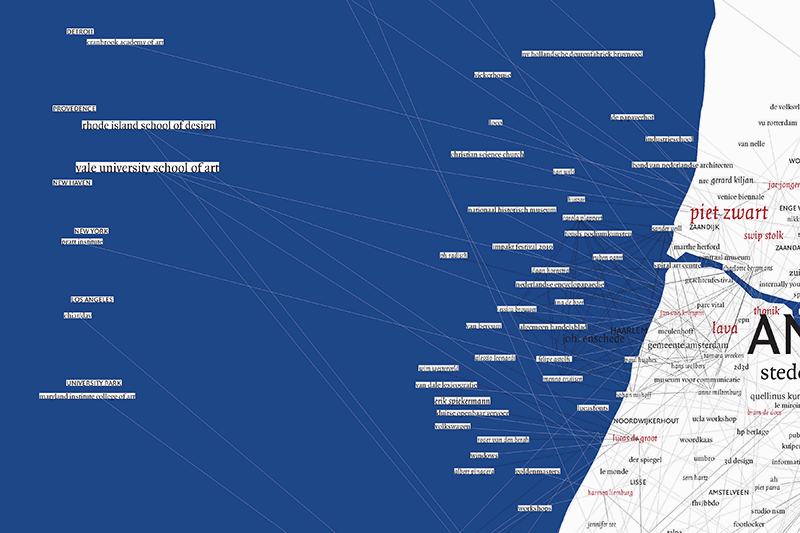
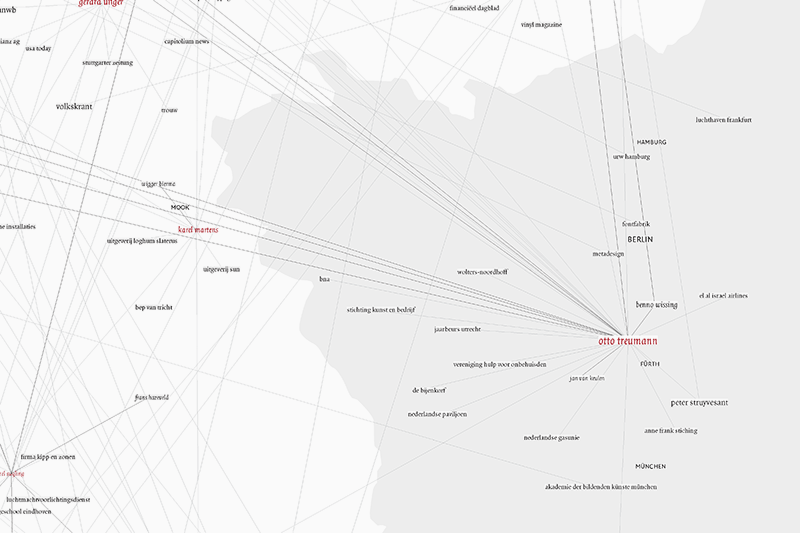
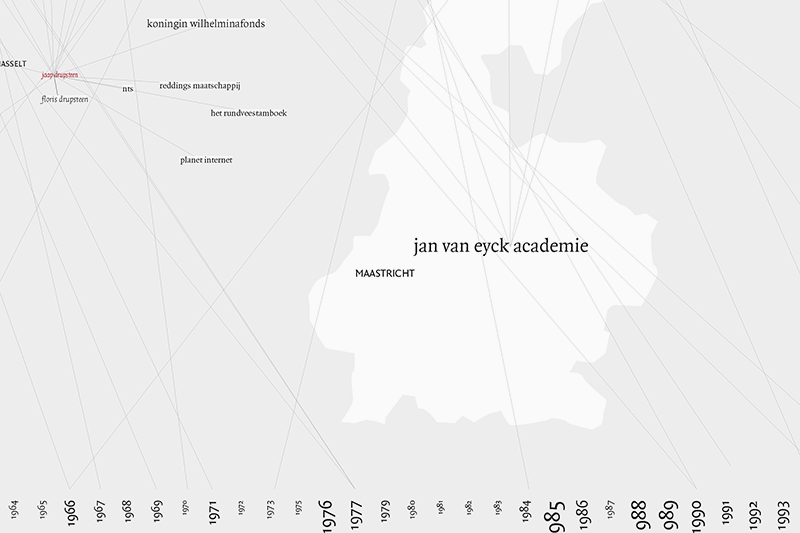
📂Dutch Graphic Design History This information graphic offers a historical perspective on the emergence of professional networks of graphic designers in Netherlands. Seminal designers and their collectives, collaborations, commissions, exhibitions, publications, educational backgrounds, places of birth, places of work, awards, prizes, related artistic movements were studied. While all included designers were professionally active in the past twenty-five years (1985–2010), their biographical information spans an impressive period of 127 years. This historical information is used and visualised as a geographical network, which puts a special emphasis on the geography and localities of professional design culture. This network is grounded geographically, but is also grounded temporally with a timeline (the bottom edge of the graphic). Each piece of information is located and some pieces are also dated. In particular, this rendition highlights the networks that have emerge over time among these Dutch designers and through their (shared) professional activities. It becomes apparent that most Dutch graphic designers, at one point in their careers, have been professionally active in the capital city. It is also surprising to learn that so many of these designers have their networks within the country, with only a small number of exceptions. There are biographical relations to the United States, United Kingdom, Germany, Belgium, and Switzerland. Nodes are different kinds of information and lines are connections across these pieces of information. Different typography and character styles are used to visually distinguish the kinds of information included. Sans-serif capital fonts are used only to display geographical locations and the timeline dates. Serif fonts are used for names of institutions, and most other information. Italic fonts are used only for the names of designers (the starting points for data collection). Font sizes indicate the ranking of each node, which is a measure of their degree (i.e., a count of the connections).